
NEXTMap One is available as a DSM (digital surface model) or DTM (digital terrain model). With a DSM, it is also possible to see buildings and trees, whereas, with a DTM, just the bare earth surface is presented. A DSM might be particularly useful for visualizing hazards down to the individual building level. A DTM might be more useful for slope and soil removal calculations.
The location of new real estate comes with inherent uncertainties: what environmental hazards could affect this site? Before you build, consider the often-overlooked factor of elevation.
Logistics of new real estate
In real estate development, before you select a site for a new building, many aspects must be considered before the construction phase.
Logistics within real estate is not a new concept; however, new technologies are taking it to the next level. High-powered modeling software and precision data allow the industry to plan and better identify potential problems before they happen. An example of this is the integration of environmental factors into the planning process.
One of the most commonly overlooked aspects before investing is mitigating environmental uncertainties on the site, many of which can be attributed to elevation. The elevation is an important indicator for many costly hazards associated with a specific location of interest, such as landslides, flooding, sea-level rise, and accessibility.
The elevation is used not only to identify hazards but also to estimate how much preparation will be necessary on a landscape for new construction, including grading and calculating how much soil needs to be removed or added. Costs can be estimated ahead of time and better budgeted even before the first survey occurs.
NEXTMap One is a high-resolution elevation dataset designed for precision analysis. It is one of the most accurate digital elevation models (DEMs) on the market, with up to 1-meter (3.24ft) resolution, now available as a subscription service exclusively from cloudeo.
With NEXTMap One as a Service, you can quickly analyze your area of interest to determine the feasibility of a new site before you build to minimize the uncertainty of future issues. Quick analysis in GIS software can reveal more than meets the eye.
Landslides
The slope is an important component in calculating the chance of landslides. Although it is not the only factor, it can be an important indicator, especially if homes are built on a steep slope or the top of a hill close to the slope edge.
Slope information can easily be derived with the industry-leading NEXTMap One as a Service elevation data in most free and commercial GIS Mapping software.
Flood Assessment
Elevation data can be used to evaluate the risk of flooding. If an area is within proximity to a river, in a floodplain, or has previously experienced flash-floods, elevation can reveal how much water the property would be subjected to in a flooding event.
Find the lowest elevations nearby a river or run hydrology analysis in professional GIS analysis programs on the NEXTMap One elevation data.
Sea level rise
Coastal properties face the risk of rising sea levels. How close to the water should a waterfront property be if there are just a few inches of sea-level rise? How does that affect the property value long-term?
Use the NEXTMap One data in gis software to estimate where the new coastline would be with a loss of coastline due to a rise in sea level.
Accessibility
During the construction phase, how will the materials be brought to the site? Are roads and infrastructure good enough for large trucks to bring the materials? If flooding or a landslide were to occur, how would that affect access to the site?
Overlay infrastructure data with NEXTMap data in GIS software. Identify where roads run along with landslide-prone steep areas or if roads at low elevation near your area of interest are at risk of flooding.
Case in point: seasonal flooding
Along the Mississippi river exists seasonal flooding due to spring rains. This year, it is currently experiencing the highest amount of flooding since record-keeping began in the 1800s. The river is nearly 23 feet (7 meters) deep, about 8 feet (2.5 meters) above flood level. (USA Today)
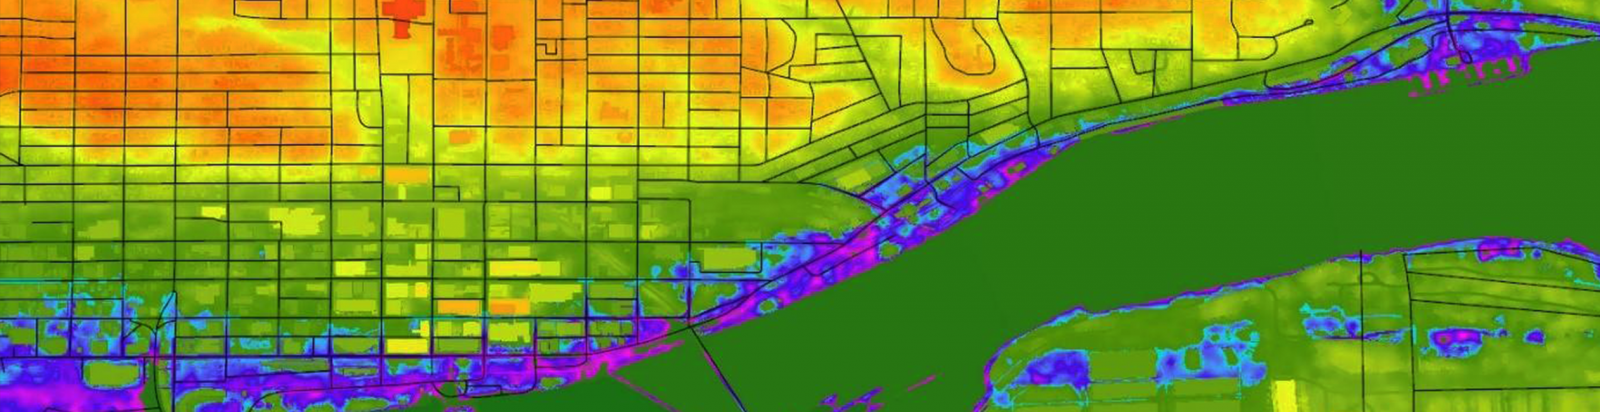
Here is the NEXTMap One elevation map, or DSM digital surface model, over Davenport, Iowa, a town of about 100,000 people.
Green areas in the image are lower elevation, and red areas are higher elevation.
Infrastructure Data
With free TIGER files road data overlayed on top of the DSM, it is possible to see the roads and the elevation information together. Roads over the dark green areas are built at low elevations, while roads over lighter areas are built over higher elevations. (US Census Bureau)
Low Elevation Areas Highlighted
Using the DSM, which includes buildings and infrastructure, it is possible to see exactly which structures will be affected if the river rises to a specific level, in this case about 14 feet (4.2 meters) above the normal water level. This analysis is possible because of the high resolution of the elevation data.
Even the pedestrian and cycling bridge in the middle of the frame could be affected by a flood this high.
heck, your potential construction site or new real estate investment with NEXTMap One before you build to reduce the risk of damages from flooding, landslide, sea-level rise, or accessibility.
The NEXTMap One dataset is the industry-leading 1-meter resolution (3.28ft) elevation data set built with 2016 or newer satellite data, so you know you are getting the most up-to-date information available. It is 6 times more precise than free data and is more affordable than other commercial options, making it the best bang for your buck.
The seamless data set offers coverage free from blunders, seam lines, or spikes that can be visible in other datasets.
With availability over the whole USA and Germany, you can get the coverage you need for your project. Water bodies and coastlines are flattened and corrected for accurate measurement. And NEXTMap One operates natively with all of your other data or programs since it's compliant with the OGC data standards.
NEXTMap One is available as a DSM (digital surface model) or DTM (digital terrain model). With a digital surface model software, it is also possible to see buildings and trees, whereas, with a DTM, just the bare earth surface is presented. A DSM might be beneficial for visualizing hazards down to the individual building level. A DTM might be more useful for slope and soil removal calculations.